Interactive Data Visualization For Analytics
Predictive Analytics Delivering Greater Insight
SAS Visual Data Discovery provides a point-and-click interface to the advanced analytic capabilities of SAS. It enhances advanced analytics and exploratory data analysis with interactive data visualization, leading to better analyses, faster decisions and more effective presentations of analytic results.
Benefits
Allows users to interact with graphs to clarify results and take action. SAS Visual Data Discovery provides exploratory data analysis and interactive data visualization in an extendable point-and-click environment, dynamically linking statistics with graphics.
Provides immediacy and responsiveness for greater productivity. All data is held in memory during visualization, rather than having to wait while data is moved from and to disk. It takes advantage of multithreading to work faster in multiprocessor machines.
Overcomes data limitations. There are no limitations on table sizes, so you are limited only by your operating system and your computer’s RAM.
Provides a powerful and comprehensive analytical environment without having to code. Users can point-and-click their way through the interface and customize analyses with their own SAS programs.
Helps achieve corporate and governmental compliance. You can generate repeatable results that are easily documented and verified.
Features
Highly Interactive Statistical Graphics
Animated bubble plots show data with sized bubbles that move over time.
3-D scatter plots with categorical and continuous data.
Scatter plot matrix with categorical and continuous data.
Trellis plots.
Summary charts.
Line plots.
Needle charts.
Creation of new graphics via the JSL programming language.
All graphics interact via the data table with brushing, highlighting, hiding and other capabilities.
Many other graphical reports.
Visual querying and data filtering
Handle virtually unlimited data.
Rearrange data at will.
Interactively tabulate data.
View and interact with dynamically linked statistics and graphics
Extensible Visual Analytics
Extend beyond built-in analytics capabilities by adding custom analyses with the SAS programming language.
Comprehensive Set Of Tools For Advanced Statistical Analysis
Analysis of variance.
Regression.
Categorical data analysis.
Multivariate analysis.
Survival analysis.
Psychometric analysis.
Cluster analysis.
Nonparametric analysis.
Survey data analysis.
Multiple imputation for missing values.
Power and sample size computation.
Time series analysis.
Design of experiments.
Nonlinear modeling.
Decision trees.
Core SAS® Capabilities
SAS® Analytics.
SAS® Stored Processes.
Integrated metadata.
SAS code.
SAS reports.
SAS output.
Screenshots
1. 3-D surface plots allow you to explore complex multidimensional spaces in an interactive environment that can be rotated.
2. Motion-enabled bubble plots show the variation in the value of any specified variable over time, business segment and company name.
3. The prediction profiler with simulation and optimization capabilities can be used to meet specific financial goals by determining the best mix of four mutual funds in a portfolio.
4. This scatter plot with nonparametric density contours and marginal distributions shows where the data is most dense.
5. With categorical analysis, you can analyze multiple-response data from such things as surveys, defect records and clinical trials.
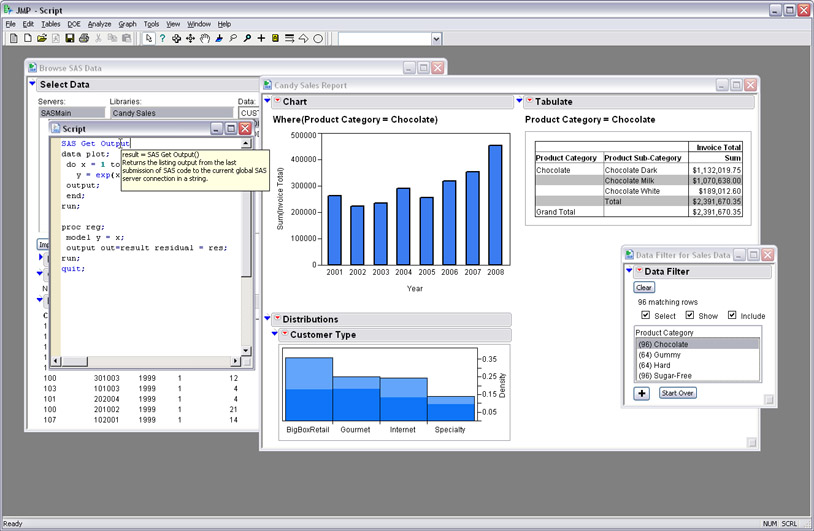
6. SAS Visual Data Discovery provides a point-and-click interface to the advanced analytic capabilities of SAS.